





In just five minutes, find out if your location is in a congestion zone, what the colors on the capacity map mean, and what you can do if the system is full.
Key fact: Netbeheer Nederland’s capacity map shows, by region, whether transmission capacity is still available, separately for off-take and feed-in. The map uses four colors plus gray for missing data, and a shading pattern that indicates whether congestion management is in effect. Red indicates a shortage of transmission capacity with a waiting list. The map applies to connections larger than 3×80 amperes.
What Exactly Is a Capacity Card?
The capacity map is a public map from Netbeheer Nederland on which the regional grid operators jointly show how much capacity remains on the power grid. You enter an address or ZIP code to see the current status of your service area. In addition to the map from the regional grid operators, there is a layer from TenneT showing the high-voltage grid, because bottlenecks are sometimes national rather than regional.
There are two things you need to understand before looking at the colors.
The map shows the current situation and does not look ahead. An area that has capacity today may become congested in six months if large requests are made in the meantime. Conversely, a red area may become available after a grid expansion.
The map operates at the regional level, not at the level of your connection. What is possible in your specific situation will only become clear once the grid operator reviews a formal transmission request. The map is therefore only a preliminary indication and does not constitute a commitment.
The colors on the map
| Color | Meaning |
|---|---|
| Transparent or white | Transportation capacity available, no wait |
| Yellow | Limited transport capacity available, no waiting list |
| Orange | Area is under investigation; there is a backlog |
| Red | Shortage of transport capacity, with a backlog |
| Gray | Insufficient data or data of insufficient quality is available |
Note the difference between orange and red. Orange means that the grid operator is conducting a congestion study. There is no available capacity at that moment, but the study will determine whether capacity can still be freed up through congestion management. Red means that the study has been completed or is not feasible: there is simply a shortage.
Netbeheer Nederland has since clarified the legend by adding shading. This allows you to see immediately whether congestion management is in effect in a given area and whether that frees up capacity for new applications. This is important because, in such an area, a flexible contract may indeed be an option, even if the primary color appears unfavorable.
A new feature compared to the first versions of the map is that, for each supply area, it also shows how much transmission capacity is available, how much is needed, how many unique requests are in the queue, and what the total requested power in that queue is. That last figure often says more than the color. A red area with a modest queue is a different story than a red area where hundreds of megawatts are on the list.
Here's how to check in at your location in five minutes
- Open the Netbeheer Nederland capacity map and enter the address of your business location.
- First, look at the layer for removal, and then at the layer for feeding. Write down both colors separately.
- Be sure to turn on the TenneT layer as well. It’s possible that the regional grid may show available capacity when the bottleneck is actually one level higher.
- Record the queue data for your supply area: number of requests and total requested power.
- Grab your utility bill and look up your contracted transmission capacity in kW and your connection rating in amperes.
- Compare that with your plans: How much capacity will you need in two to five years, taking into account electrification, charging infrastructure, or expansion?
The difference between point five and point six is the problem you need to solve. Often, that difference turns out to be smaller than expected, because it’s not about your average consumption but rather a few hours a year when everything is running at the same time.
Consumption and supply are two different issues
| Demand Congestion | Inlet Congestion | |
|---|---|---|
| When noticeable | Morning and evening peaks, cold days | Sunny days around noon |
| Where it is often visible | Urban and industrial areas, charging infrastructure | Rural Areas with Solar Farms and Agricultural Power Generation |
| Immediate consequences | No heavier connection; expansion stalls | Feed-in will be limited or shut off |
| Financial Loss | Lost production, delayed electrification | Lower solar panel efficiency, negative prices |
| Solution with storage | Handling Peaks Within Existing Capacity | Save the surplus and use it later |
A manufacturing company with solar panels on its roof can easily receive additional power while, at the same time, not being allowed to feed back a single extra kilowatt. That may seem contradictory, but it makes sense: the grid operates in two directions, and those directions become overloaded at different times.
What to Do If Your Area Is Designated Red or Orange
Waiting for the network to be upgraded is the path that requires the least effort but takes the most time. Network operators are continuing to build out the network, but expanding stations and laying cables takes years, not months. In the meantime, there are four options you can take into your own hands.
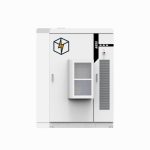
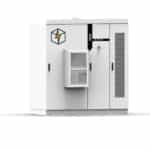
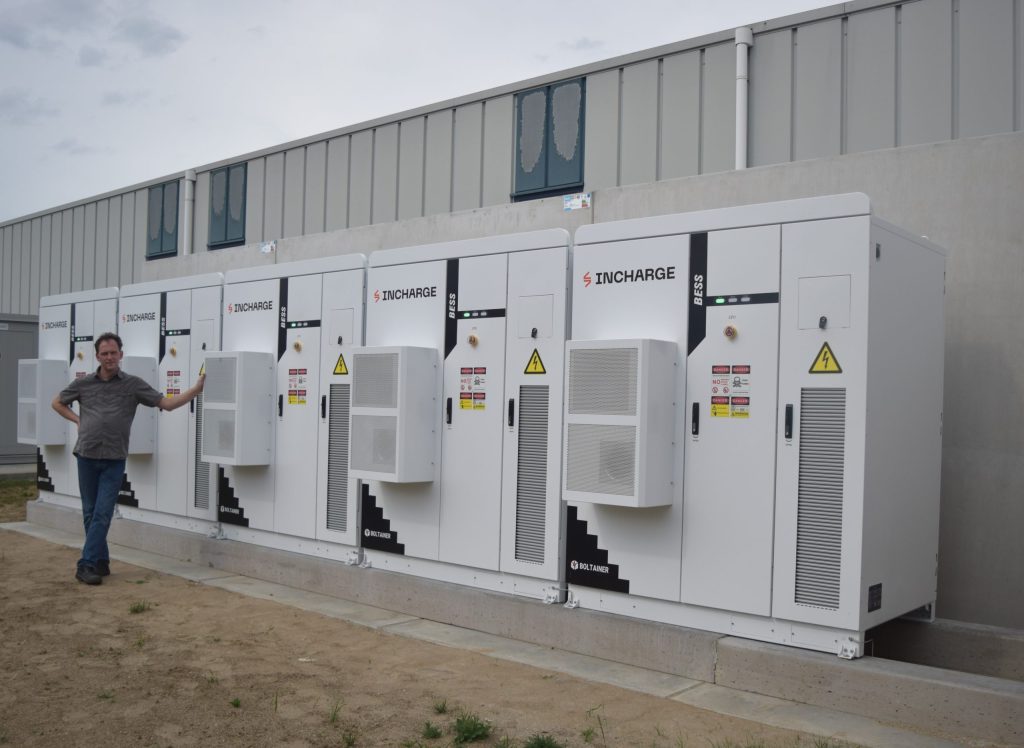
Stay within your existing capacity. Peak shaving allows you to absorb peaks using a battery, so that your contracted transmission capacity is sufficient to handle heavier operational demands. This is the approach that yields the fastest results in most cases, because you don’t have to make any changes to your connection.
Exploring a flexible contract. In areas where congestion management is in effect, grid operators offer capacity outside of peak hours. Without storage, this means reducing demand at times you don’t choose yourself. With storage, you can bridge those hours and keep your process running.
Store your surplus energy instead of feeding it back into the grid. In the event of grid congestion, that’s the only measure that works immediately. You can use the solar power you generate at noon during the evening peak or when charging vehicles.
Shift your energy consumption. Not everything has to happen at once. Phased startup of high-power consumers, charging outside of production peaks, and spreading out energy-intensive batches cost nothing and can sometimes free up a surprising amount of capacity.
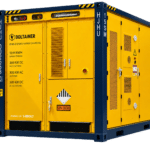
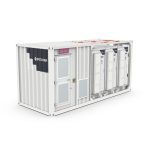
All four routes have in common that they make use of existing infrastructure. That is also why a battery system can be implemented in a matter of weeks, while upgrading the grid takes years.
What the Map Doesn't Tell You
The map provides no information about the estimated completion time of the work, your position in the queue, or whether congestion management has made room specifically for you. Nor does the color indicate whether a flexible contract is a good fit for your situation—that depends on your usage profile.
What the map does, however, is show you whether a standard application will get you anywhere or whether you need to start thinking right away about a solution behind the meter. This is valuable information when choosing a location for new construction or an expansion, especially if you’re considering multiple sites.
Frequently Asked Questions About the Grid Congestion Map
Is the capacity card binding?
No. The map shows the situation for each supply area and is periodically updated by the network operators collectively. It is intended as a guide so that businesses, municipalities, and developers know in advance what they need to take into account. Only a formal transmission request submitted to your network operator will provide a definitive answer regarding your connection. Be sure to submit that request even if the map looks unfavorable, because the application date will determine your place in line later on.
My area is marked in red—does that mean I can't install any more solar panels at all?
You’re allowed to install them, but you may not be able to feed the generated electricity back into the grid at all, or only to a limited extent. Therefore, be sure to look specifically at the feed-in tier and not just at consumption. With storage, you can use that electricity yourself when you need it, which means the business case can still work out. In practice, the return on investment then shifts from feed-in tariffs to avoided purchase costs, and at current rates, that’s often more favorable.
Does a red area ever turn green again?
Yes, after grid expansion or when existing users return capacity. Grid operators periodically publish new congestion studies and update the map accordingly. Just don’t count on this happening within your own investment horizon: the queues are currently growing faster than the grid is expanding. So base your plans on the current situation and treat any potential expansion as a windfall.
Does grid congestion also apply to my small connection?
That has been the case since July 1, 2026. Until that date, grid operators reserved capacity for small consumers up to 3×80 amperes, which meant they were connected more quickly than large consumers. The ACM found that difference unjustifiable, and as a result, everyone in a congestion area is now placed on the same waiting list. The capacity map itself, however, remains focused on connections larger than 3×80 amperes.
Why is my area grayed out?
Gray indicates that there is insufficient or unreliable data available for that area. This does not indicate whether or not capacity is available. In that case, contact your grid operator or submit a transmission request immediately, as this is the only way to receive a well-founded response regarding your situation.
What does the shading on the map mean?
The shading indicates that congestion management is in effect in that area and whether this frees up transmission capacity for new requests. This is often the difference between an area where you really can’t do anything and an area where you can still secure capacity through a flexible contract. Be sure to ask your grid operator about this explicitly, as it isn’t always offered proactively.
How do I know how much power I'll need later?
By requesting your quarter-hourly consumption data from the past year from your utility provider and adding your planned electrification to that. When doing so, don’t look at your annual consumption in kWh, but rather at the highest quarter-hourly consumption values in kW and how often they occur. In a simulation report, we’ll run the numbers and compare them to your current contract.
Can I use the map when selecting a location?
Yes, and that’s one of the most useful applications. If you’re considering a new location or expansion, checking in advance where there’s still capacity for both off-take and feed-in can save you years. Be sure to also factor in the waiting list data for each supply area, as that shows just how fierce the competition is for the remaining capacity.